Introduction In one of the biggest tech acquisitions of 2022, Broadcom acquired VMware for a staggering $61 billion. This move has significant implications for VMware customers, as Broadcom plans to transition VMware’s licensing model from perpetual to subscription-based. While this shift may provide more flexibility, it also carries the potential for substantial cost increases. To navigate these changes and avoid unnecessary expenses, customers need to be proactive in optimizing their VMware licensing. That’s where our

One common impediment we hear concerning moving Oracle workloads to AWS concerns Oracle RAC. Most of the Oracle customers that have purchased and implemented Oracle
Overview With all of the database platforms and cloud service providers available, it is becoming more likely that companies will have databases running on multiple
Licensing Oracle software in AWS can be, let’s face it, half as efficient as licensing it on-premises. Why? In the cloud, if you can’t identify

Updated on 2-16-24 by Nathan Biggs (@nathanbiggs), CEO I wrote the blog post below five years ago. I am amazed at how prescient those recommendations

History of Product Packaging and Price Increases following a Merger or Acquisition of a Leading IT Company It is a story that anyone who has

Introduction Today, organizations of all sizes are migrating their databases and applications to cloud environments to provide enhanced scalability and cost-efficiency. Now with more organizational

Introduction Oracle customers who find themselves in certain precarious situations relative to their Oracle licensing often find that the cure-all salve from Oracle is the

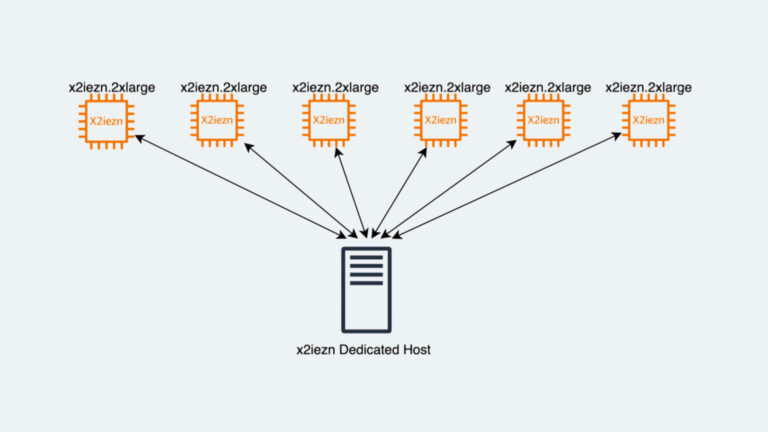
In June of 2023 Oracle announced support for their database on ARM-based platforms. The significance of this is the fact that ARM architecture is making significant

The biggest risk our clients face related to Oracle licensing is the risk of unknowingly using database features. With Oracle, these features all require a
Business Case for OLA The lifecycle of public cloud adoption for mission critical workloads continues to progress. More of our clients every year embrace public